|
|
Dynamics of Protein Oscillations |
Single Particle Tracking Method for Quantitative Tracking and Biophysical Studies of the MinE Protein
..... The dynamics of the MinE protein has been recognized to play an important role in accurate placement of the septum during cell division. The system is of great interest since it represents one of the few biologically self-sustaining oscillatory systems in an organism that can be well-studied at physical, generic, and biochemical levels. In this work the single particle tracking (SPT) was, for the first time, applied to investigate the MinE behavior in an E. coli system. The SPT data monitored from the dividing E. coli cells, 5.08±0.82 mm in length, have demonstrated an oscillation of the MinE protein between the two poles with an average period of 266.64±122.29 seconds. The results for the oscillating trajectory and velocity can be classified according to the space and time scales of dynamic events into two types: flight event and switching event. The switching event mostly occurs near polar zones, while the flight event takes place between the switching events in the space between the polar zones. From quantitative analysis, we found the flight events to occur with an average flight velocity of 0.23±0.08 mm/s, and flight events to occur during turning at the poles with the average switching velocity of 2.16 ±0.68 mm/s. The agreements between our findings and those from previous studies are discussed. These results demonstrate the benefits of applying SPT to investigate the oscillation of targeted proteins in both qualitative and quantitative aspects. The emphasis of this report is not on discovering biophysical information but on providing a new methodology to obtain information that will be essential to evaluate the many mathematical models that have been proposed to account for the Min protein oscillation
Selected Results
|
|
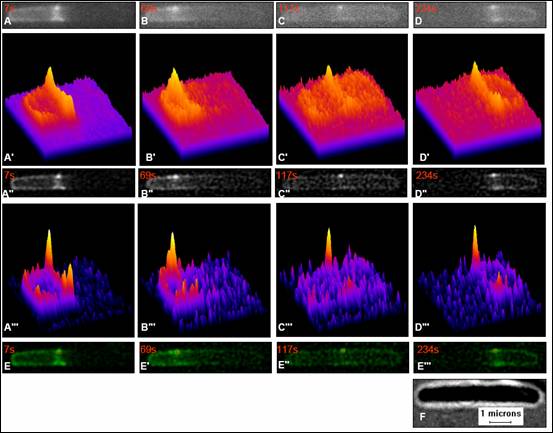
Figure 1 Image processing and SPT results for RC1/pSY1083G [∆min/Plac - DminC DminD DminE ::gfp] . Fig. 1A, B, C, and D show raw fluorescence images at time 7s, 69s, 117s, and 234s. Fig. 1A', B', C', and D' are intensity plots of fluorescence images corresponding to the high intensity cluster of raw image Fig. 1A, B, and C respectively. Fig. 1A", B",C", and D" show the results of images after filtering Gaussian option from ImageJ and Rescaling option from SpotTracker plugin that corresponds to the intensity plots Fig. 1A′″, B′″, C′″, and D′″(fourth row from above). Fig. 1E, E′, E″, and E′″ show the results of fluorescence images in green with red plus sign which indicates the high-intensity spot after tracking in the same time interval. Fig. 1F shows a differential interference contrast (DIC) image showing ~5.5 mm of cell length.
|
|
Figure 2 The raw time-lapse and enhanced 2D-image sequence of MinE oscillations at different moment of time corresponding to a trajectory product of SpotTracker plugin. Fig. 2A shows 2D image sequence of MinE oscillations. The first column exhibits the raw fluorescence image sequence, the next column represents the product of signal enhacement of image sequence by SpotTracker plugin. Each fluorescent image shows a small cluster of GFP:MinE as bright spot that moves from midcell to polar zone and backward near the midcell displayed in first three rows. A product from SpotTracker plugin as shown in Fig. 2B in which a red line corresponds to a GFP signal trajectory of MinE oscillations on x(t) axis. Similarly, as shown in Fig. 2C, the red line on y(t) axis is the spot projection exhibiting the GFP signal trajectory. Fig. 2D is a time evolution plot of positions on x(t) axis as a dotted line and on y(t) axis as a solid line.
|
|
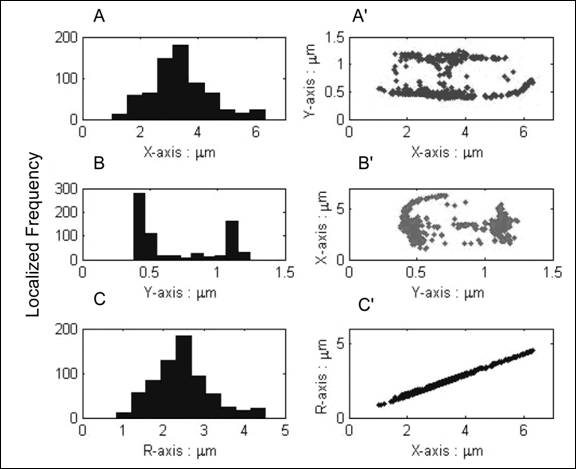
Figure 4 The frequency histogram and positional scatterings of GFP:MinE localization. Fig. 4A, B, and C are histograms that exhibit the localized frequency and patterns of GFP:MinE proteins represented along to x, y, and R axis respectively. Fig. 4A', B', and C' show positional scatterings qualitatively exhibiting distributions of GFP:MinE on x-y, y-x, and R-x plot respectively.
|
|
Figure 3 The comparison between distance and velocity time evolution during 570 seconds. Fig. 3A exhibits a time evolution plot of R ( ). The ring-structure moving time (RSMT) indicates the time at midcell to polar zone, and the ring- structure moving length (RSML) indicates the distance of GFP:MinE moving from the polar zone to the midcell. An oscillation period (~456 seconds for this cell sample) is the measurement of three switching velocities or three switching events as peaks shown on Fig.3B. Black arrows under Fig. 2B indicate switching events including the switching velocity and RSML. Events that GFP:MinE get trapped between two switching events are called the flight event including the flight velocity and RSMT (details in text). ). The ring-structure moving time (RSMT) indicates the time at midcell to polar zone, and the ring- structure moving length (RSML) indicates the distance of GFP:MinE moving from the polar zone to the midcell. An oscillation period (~456 seconds for this cell sample) is the measurement of three switching velocities or three switching events as peaks shown on Fig.3B. Black arrows under Fig. 2B indicate switching events including the switching velocity and RSML. Events that GFP:MinE get trapped between two switching events are called the flight event including the flight velocity and RSMT (details in text).
|
Stochastic modeling of the effect of an external electric field
on the Min protein Dynamics in E. coli
Charin MODCHANG, Wannapong TRIAMPO*, Paisan KANGTHANG, Udorn JUNTHORN,
Somrit UNAI, Waipot NGAMSAAD, Narin NUTTAWUT
R&D Group of Biological and Environmental Physics (BIOPHYSICS),
Department of Physics, Faculty of Science, and Center of Excellence for Center for Vector and Vector-Borne Diseases, Mahidol University, Bangkok, Thailand
Yongwimon Lenbury
Department of Mathematics, Faculty of Science, Mahidol University, Bangkok, Thailand
PACS number: 87.15.Aa
Keywords: Electric fields, E. coli, Cell division, Min proteins, MinCDE oscillation, stochastic process
Corresponding author
scwtr@mahidol.ac.th or wtriampo@yahoo.com
R&D Group of Biological and Environmental Physics,
Department of Physics, Faculty of Science,
Mahidol University, Rama 6 Rd., Ratchatewee, Bangkok, 10400 Thailand
Phone: 662 441-9816 ext. 1131
Fax: 662 441-9322
Abstract
Cell division in Escherichia coli and other rod-shaped bacteria depends on the precise placement of a division septum at the cell center. The MinCDE system consisting of three proteins: MinC, MinD, and MinE, controls accurate cell division at the center of the cell through pole-to-pole oscillation. With some simplifying assumptions and relying on our deterministic model, we present a one-dimensional stochastic model describing effects of an external electric field to the MinCDE system. Computer simulations were performed to investigate the response of the oscillatory dynamics to various strength of the electric field and the total number of Min proteins. Providing a strong enough electric field, it has been found, is capable of interfering with the MinCDE dynamics as a consequence of the possible change in the division process. Interestingly, it was found that the effects of an electric field do not depend on the total number of Min proteins. The noise involved has shifted the correct trend of Min proteins behavior. However, as a consequence of the robustness of the dynamics, the oscillatory pattern of the proteins still exists even though the number of Min proteins is relatively low. However, consideration of the correlations between the local and global minimum (maximum) of MinD (MinE) suggests that using high enough Min protein concentration would reduce the local minimum (maximum) effect, which is related to the probability of polar division in each single oscillator cycle.
Though the studied model is simple and neglects some complex mechanisms concerning protein oscillation in correlation with cell division, it is demonstrated to be good enough for positioning the dividing site. Therefore, with regards to this problem, more experimental and theoretical works are needed. Especially, more realistic model (of course more complicated model) development through deterministic and stochastic approaches is still very much in need. Lastly, it is to be mentioned that this study may be of significant importance in the development of new technological processes in the fields of agriculture, food and medicine.
Selected results (Full paper..(pdf))
|
-----------------------------------------------------------
-----------------------------------------------------------
|
Relative concentrations of MinD (above) and MinE (below) as functions of position x along the bacterium length under the influence of an electric field with J = 0.3 m/s. The curves show that varying the total number of Min proteins does not change the MinD global minimum and MinE global maximum position.
|
-----------------------------------------------------------
|
Relative concentrations of MinD (above) and MinE (below) as functions of position x along the bacterium length under the influence of an electric field for N = 1500. The curve shows a shift, which depend on the strength of the field, in the local minima of the MinD and the local maxima of the MinE from the mid-cell
|
-----------------------------------------------------------
|
Plots of the concentrations of Min proteins: (a) MinD and (b) MinE. The plots are focused at the left end grid (·), and the right end grid (x) as functions of time in seconds for J = 0.0 m/s to J = 0.3 m/s. The vertical scales denote numbers of protein copies in the system. The horizontal scale spans time for 500 s.
|
|
Min Protien Oscillation by Miss Yaowapa Saengpayap.
Min protein oscillations in Escherichia coli
Escherichia coli (or E. Coli; see Fig.1) is a kind of bacteria that are prokaryotic cells.
They are one of the best-studied prokaryotic models [see reference 1], the studied results from E.coli often being extended or adapted to knowledge relating to other bacteria.
In E. coli, cell division is an essential process, and the selection of the division site is regulated in part by three Min proteins: MinC, MinD, and MinE. It is first reported in 1989 that they prevent it from minicell division [2]
|
Figure 1 An example of rod shape E.coli cells.
|
-
Min proteins oscillations
In order to describe their functions to the cell division site properly, Min protein dynamics have been proposed via models of Min protein oscillations. The simplest one is the model of Huang et al (2003) [3]. In this model, the reported in vitro Min proteins are accounted and described in deterministic reaction-diffusion equations. Oscillation is described as beginning with MinD in the cytoplasm binding to the membrane when there is ATP present—and where the binding MinD prefers to bind next to the preceding bound MinD, resulting in a compact polar zone of MinD. The MinD-ATP complex is activated by MinE to release MinD-ADP, phosphate, and MinE itself into the cytoplasm, resulting in the two highest intensity ring forms called the E-ring around the middle cell. The MinD-ADP is converted back to MinD-ATP in the cytoplasm, and diffuses to the other pole where the process is repeated, resulting in the repeated characteristic of Min protein dynamics called Min protein oscillations. The schematic diagram for these oscillations is illustrated by Fig. 2
|
|
Figure 2 Model of MinD, MinE cycle driven by ATP hydrolysis. In this model MinC is thought to be co-localized with MinD. In the first step, the cytoplasmic MinD-ATP complex attaches to the membrane, preferentially where other MinD-ATP is bound. 2: MinE in the cytoplasm attaches to a membrane-associated MinD-ATP complex and releases MinD-ADP (3a), phosphate (3b), and MinE (3c) into the cytoplasm. 4: MinD-ADP is converted back into MinD-ATP by the nucleotide exchange process.
3. The latest research
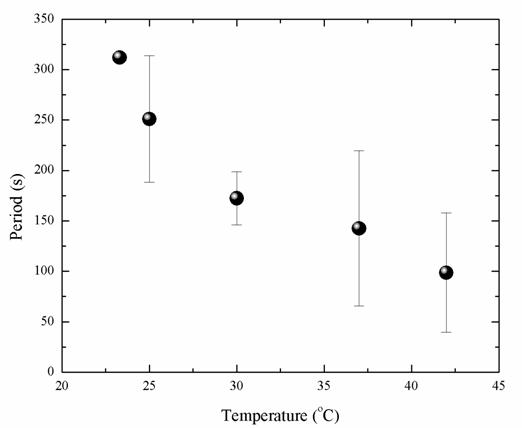
The research investigate the effect of temperature on the dynamics of MinE protein oscillation by monitoring pattern formation and measuring the dynamics of MinE protein clusters, including positions, speed, and (more importantly) periods, using a spot tracking technique (STT).The experimental results of the periods from 12 individual cells is shown in the Fig. 3. The oscillation period of MinE protein decreases when temperature is increased. Specifically, the MinE oscillation period decreases about threefold as the temperatures changed from 23.3 to 42.0oC, which is consistent with studies on the growth rate of E. coli. The study characterized the detailed dependence between the period and temperature as an exponential decay. It is proposed that this dependence might relate to the Arrhenius equation, with an estimated activation energy of 10 kcal/ mol. The results could establish a knowledge-base for the relationship between the cell division process and the temperature-dependent rates within a prokaryotic cell.
|
|
Figure 3 The MinE oscillation periods in seconds observed at 23.3, 25.0, 30.0, 37.0, and  , respectively. The standard errors are represented by the vertical bars. , respectively. The standard errors are represented by the vertical bars.
References
1. Fields, S., & Johnson, M. Whither model organism research? (2005), Sci.307, 1885-1886.
2. De Boer, P., A., J., Crossley, R., E., & Rothfield, L., I. (1989). A division inhibitor and a topological specificity factor coded for by the minicell locus determine proper placement of the division septum in E. coli. Cell. 56 (4), 641-649.
3. Huang, K., C., Meir, Y., & Wingreen, N., S. (2003). Dynamic structures in Escherichia coli: Spontaneous formation of MinE rings and MinD polar zones. PNAS. 100 (22), 12724–12728.
|
|
|