Wisdom of the Land

 
Granting Agency

Biophysics Web
   
   
Published Journal
 
Online Resources
 
Dictionaries
 
 
Fractal dimention


FRACTAL STUDIES ON THE SPATIAL PATTERNS OF TREES:
A CASE STUDY OF KHAO-YAI NATIONAL PARK, THAILAND


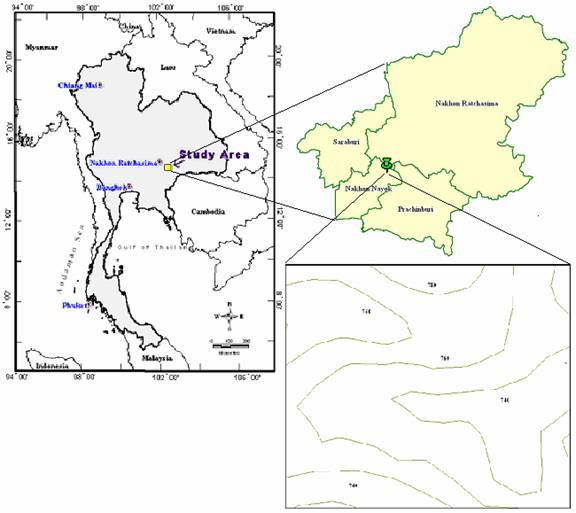
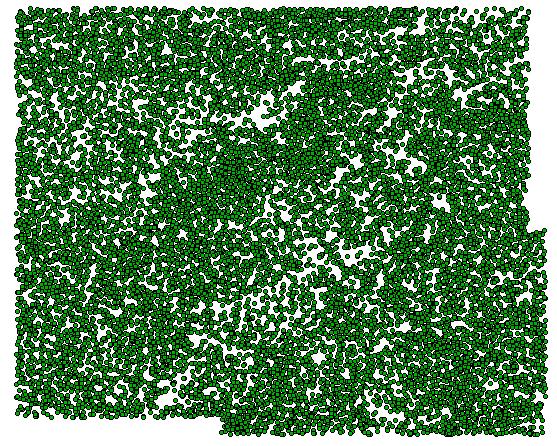
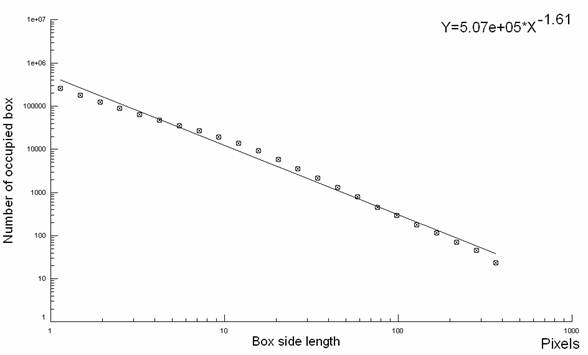
The distribution of the trees in a 600 m x 500 m (30 ha) plot in the Khao Yai National Park in Thailand containing 16,375 trees, divided into 63 families and 182 species is studied. The allometric scaling exponent in the relation between the numbers and diameters of all the trees taken as one group was -2.155 with R2 = 0.9873. The spatial heterogeneity of the forest is seen in the variation of this scaling exponent determined for each ha in the area of study. The box counting method (BCM) was used to determine the fractal dimensions (df) of the spatial patterns of the trees. The spatial pattern for all the trees taken as a whole has a df = 1.61. The fractal dimensions for the patterns of the six most abundant species and the six most abundant families ranged from 1.731 to 1.747. All of the values were within the standard deviation in the BCM calculations of the df’s.  This points to a universal value of 7/4 for the df of the trees patterns in the Khao Yai National Park.


Selected Results

--------------------------------------------------------------------------------------------------------------

Fig. 1. Location of the area of study in the Khao Yai National Park in Thailand.  The study area is a 600 meters x 500 meters or 30 hectare plot.  The study site is located at 101° 22’ E and 14° 26’ N at an elevation between 730-860 meters above sea level.

--------------------------------------------------------------------------------------------------------------


Fig. 2. Spatial distribution of all the trees in the 30 ha plot.  The plot contains 16,375 trees.  There are 35 species of trees belonging to 14 families of trees

--------------------------------------------------------------------------------------------------------------


All trees

Fig. 4. The fractal dimension interface from Benoit’s software. The regression plot of box occupancy vs. scale.

--------------------------------------------------------------------------------------------------------------


Fig. 8. Allometric relation between the number of species per ha and the area occupied by the trees.

--------------------------------------------------------------------------------------------------------------


© 2005 Biophysics Group, Faculty of science, Mahidol University. All Rights Reserved. Contact Webmaster for more information
Last Updated : October 29, 2010